> ## Documentation Index
> Fetch the complete documentation index at: https://docs.cantina.xyz/llms.txt
> Use this file to discover all available pages before exploring further.
# Grafana
> Connect Grafana to Clarion to receive alerting notifications for AI-powered triage and response.
This guide walks you through connecting Grafana to Clarion. Grafana's unified alerting system sends webhook notifications to Clarion, where AI agents triage and respond to your infrastructure and application alerts.
> **Estimated time:** 5-10 minutes. You will need access to your **Grafana instance** (with Alerting permissions) and a **Clarion workspace**.
## Prerequisites
* A **Grafana** instance (self-hosted or Grafana Cloud) with unified alerting enabled
* Alerting admin or editor permissions in Grafana
* A **Clarion workspace** with the Grafana integration available
***
## Step 1 - Create a monitor in Clarion
1. In Clarion, go to **Settings > Integrations**
2. Find **Grafana** and click **Add Monitor**
3. After you select the default severities Clarion generates a **webhook URL** and a **webhook secret** (Bearer token)
4. Copy both values - you'll need them in the next steps
> Copy the webhook secret immediately - it is only displayed once. If you lose it, you'll need to regenerate the monitor.
***
## Step 2 - Create a contact point in Grafana
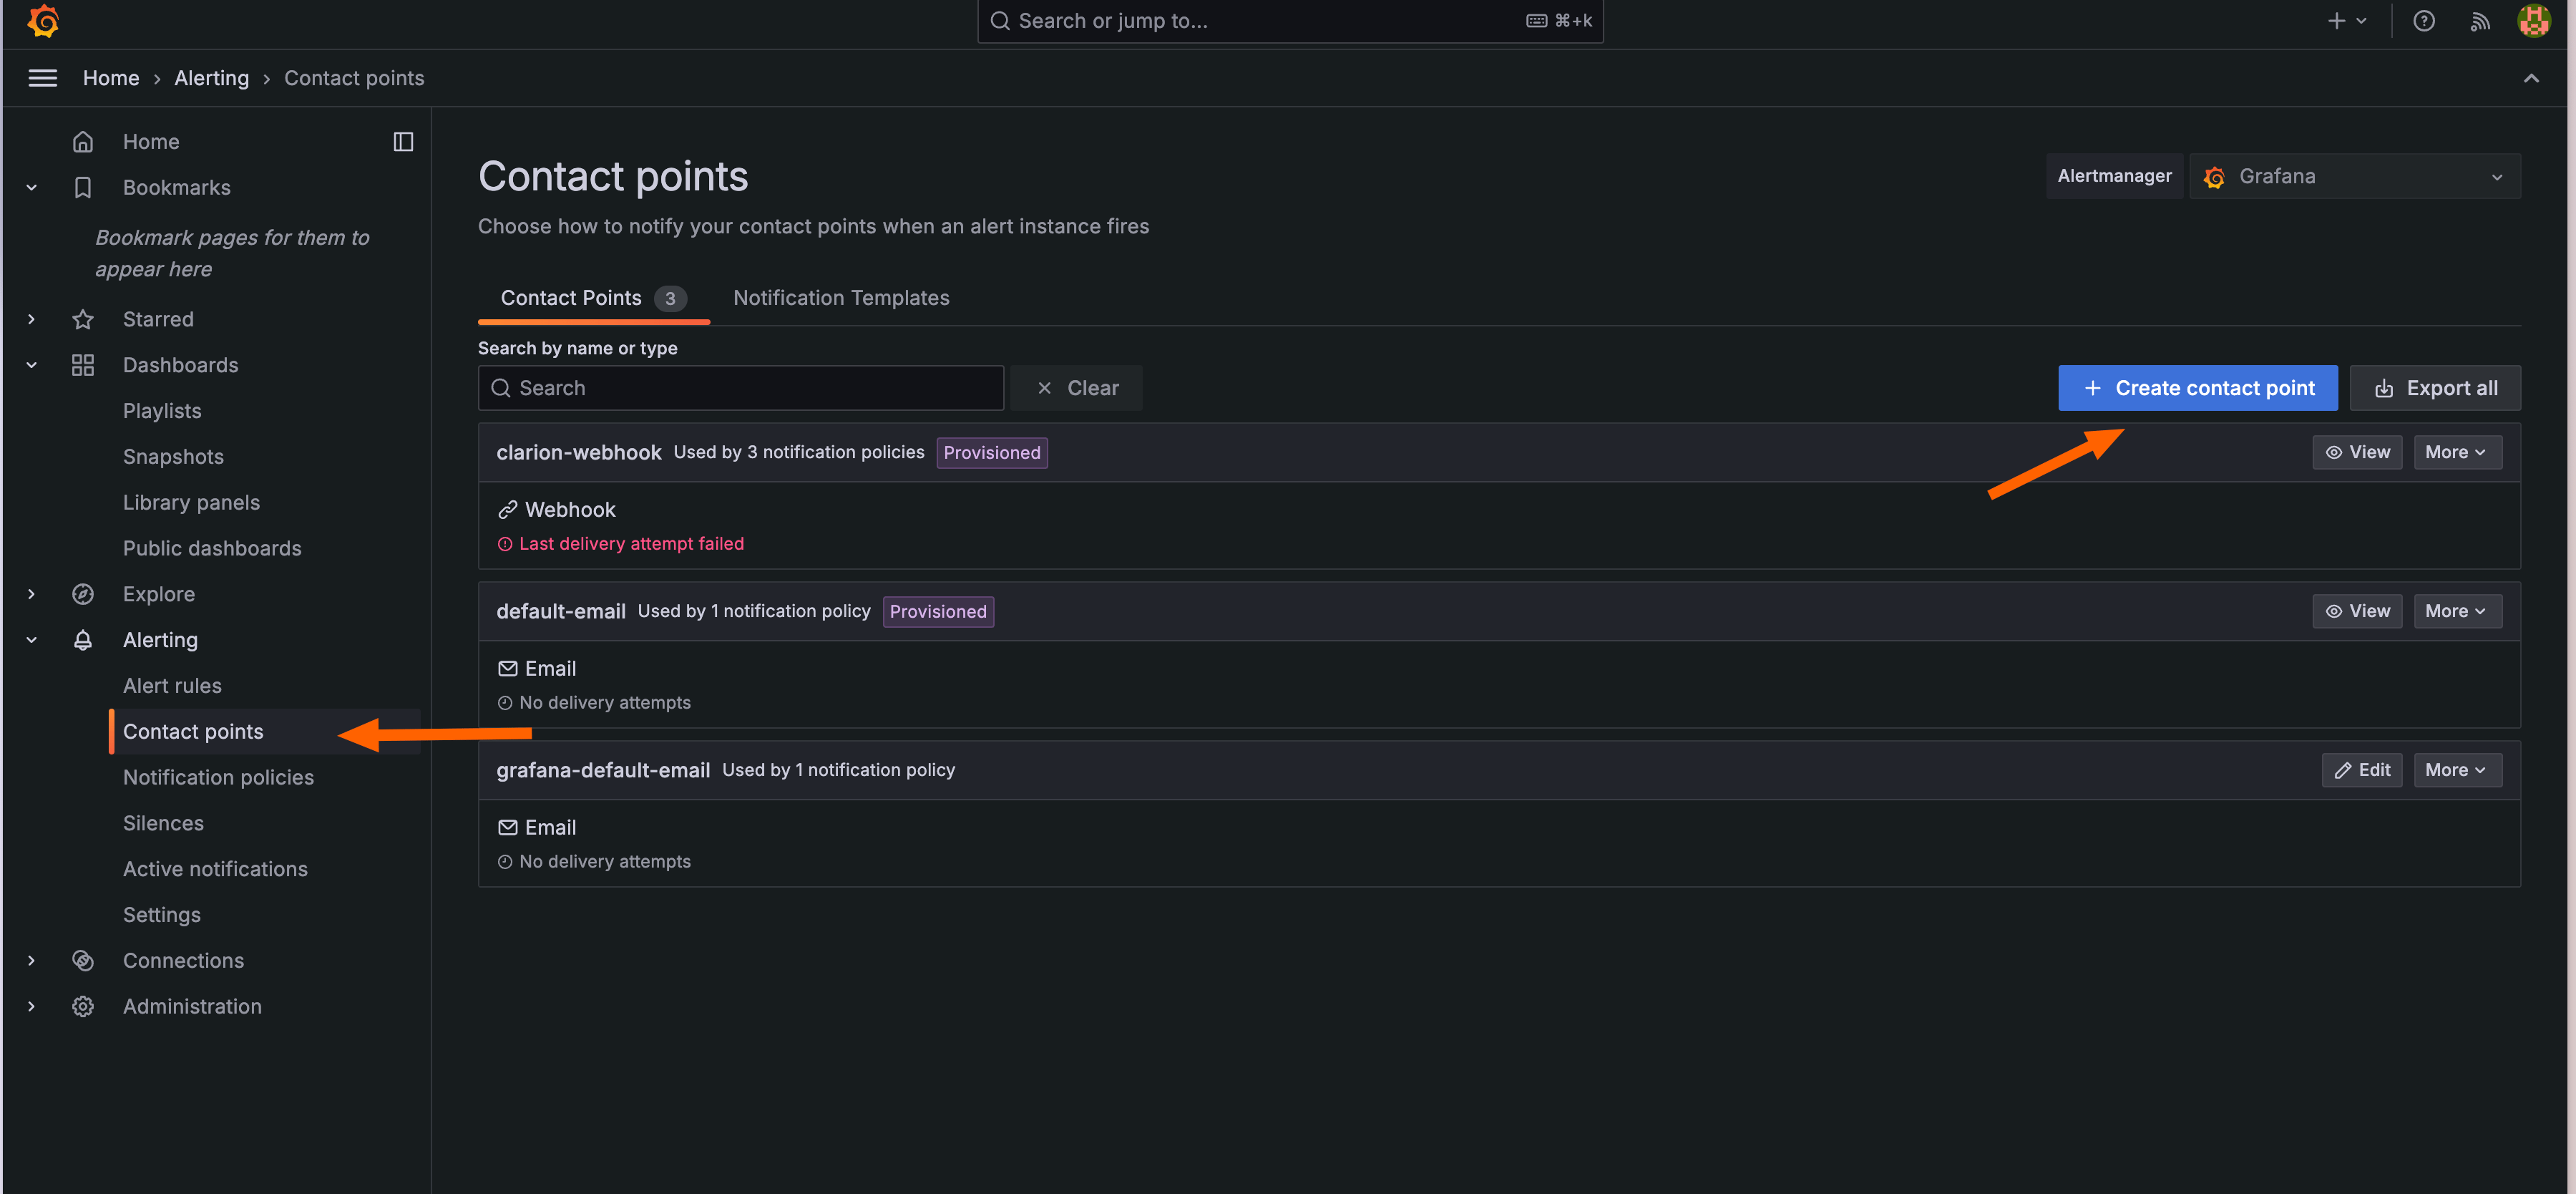
1. In your Grafana instance, navigate to **Alerting > Contact points**
2. Click **+ Create contact point**
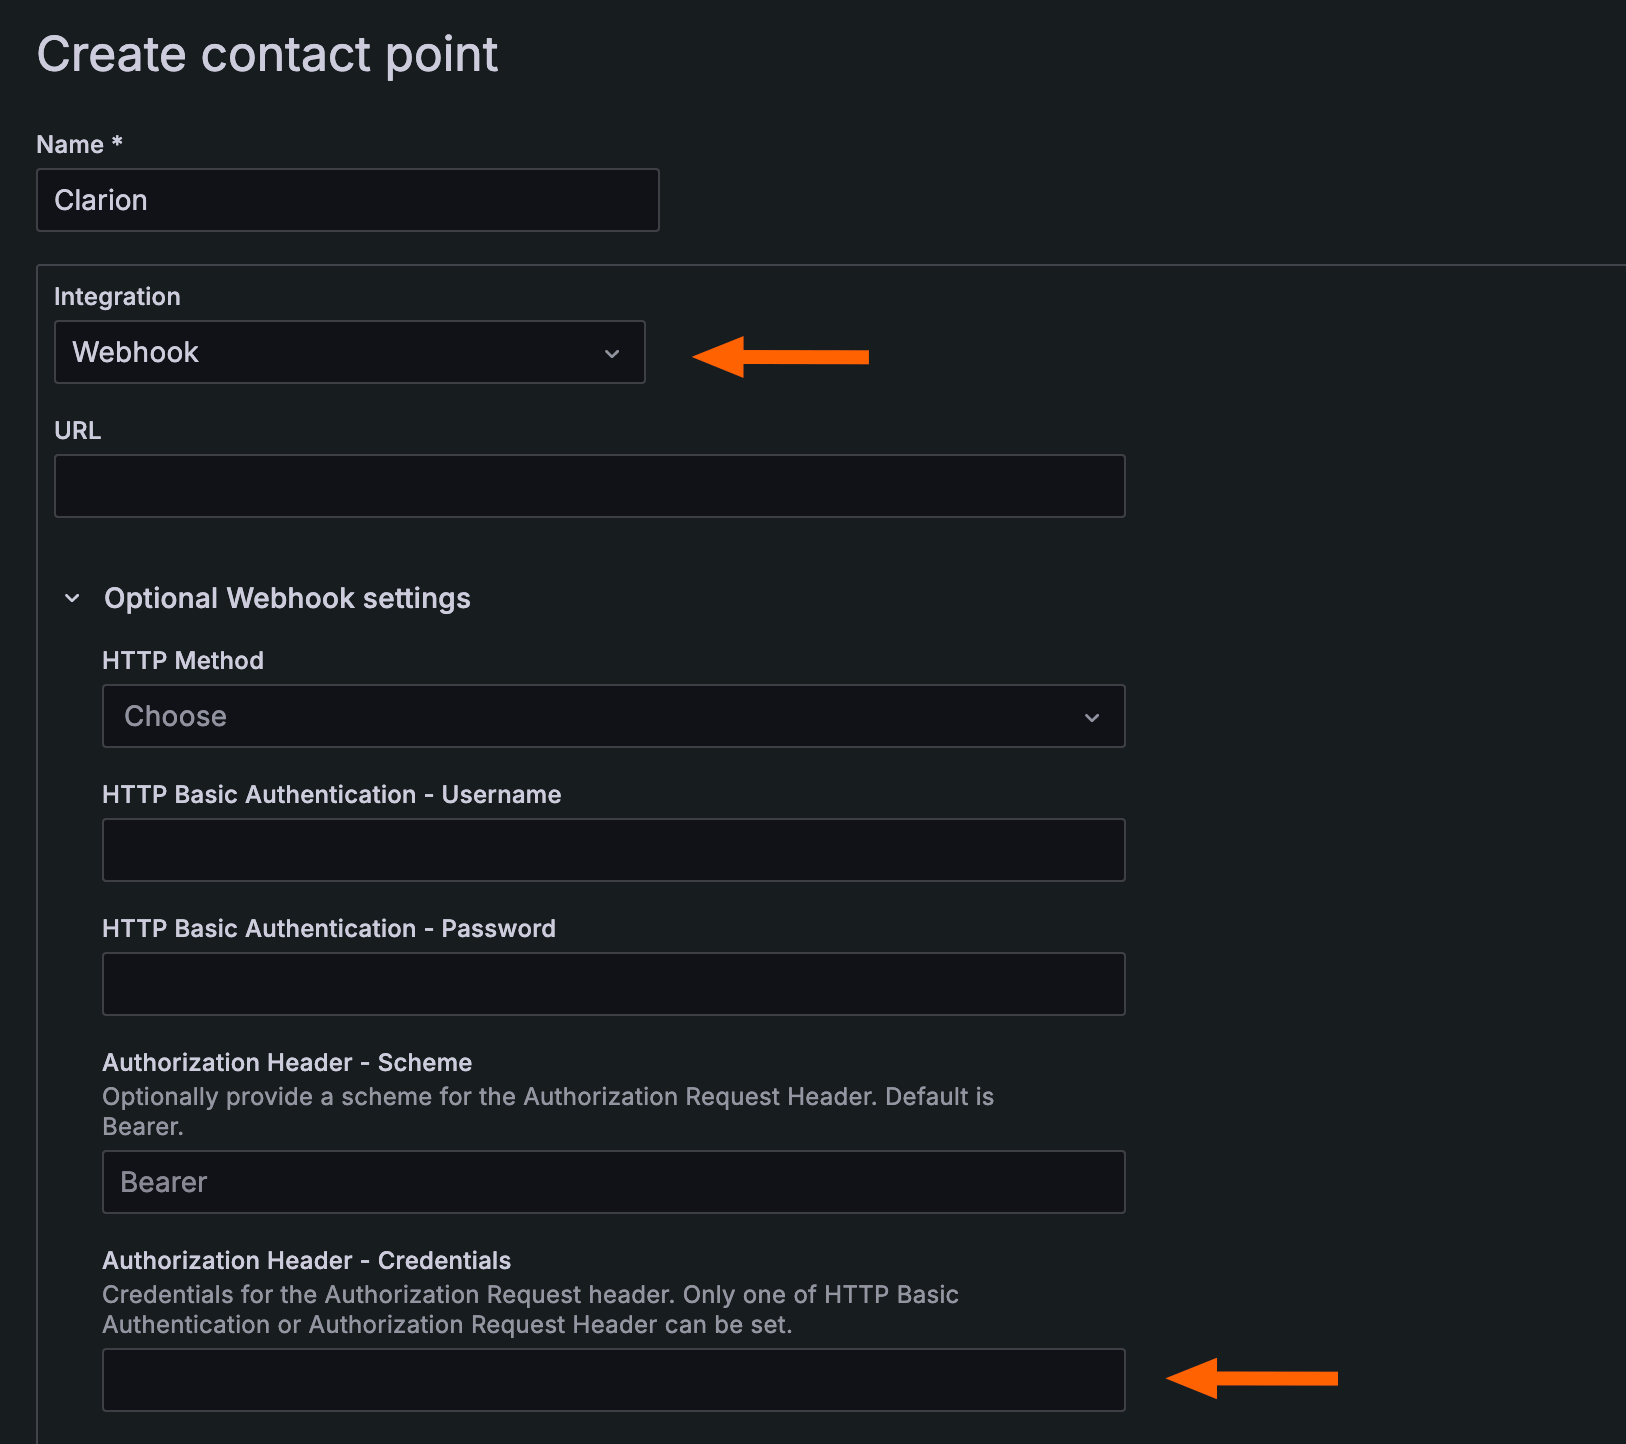
3. Configure the contact point:
* **Name**: Give it a descriptive name (e.g. `Clarion`)
* **Integration type**: Select **Webhook**
* **URL**: Paste the webhook URL from Clarion
* **HTTP Method**: Leave as `POST`
* **Authorization Header - Credentials**: Paste the webhook secret from Clarion
> Setting the **Credentials** field in the Authorization Header section causes Grafana to send the secret as a `Bearer` token in the `Authorization` header, which is how Clarion authenticates incoming requests.
1. Click **Save contact point**
 ***
## Step 3 - Route alerts to the Clarion contact point
You can route alerts to Clarion by updating your **notification policy** or by adding Clarion as a contact point on individual alert rules.
### Option A - Default notification policy
1. Go to **Alerting > Notification policies**
2. Edit the **default policy** (or create a nested policy)
3. Set the **Contact point** to the Clarion contact point you created
4. Save the policy
### Option B - Per-rule contact point
1. Go to **Alerting > Alert rules**
2. Open the alert rule you want to forward to Clarion
3. In the **Notifications** section, override the contact point and select the Clarion contact point
4. Save the rule
Repeat for each alert rule you want Clarion to receive.
***
## Severity mapping
Clarion maps the `severity` label from your Grafana alerts to its own severity levels:
| Grafana `severity` label | Clarion severity |
| ------------------------------ | ---------------- |
| `critical` | Critical |
| `high` | High |
| `warning`, `medium` | Medium |
| `low`, `info`, `informational` | Low |
| *(missing or unrecognized)* | Medium |
> To control how Clarion prioritizes your alerts, add a `severity` label to your Grafana alert rules (e.g. `severity = critical`). If no severity label is present, alerts default to **Medium**.
***
## What happens next
Once configured, Clarion will automatically:
* Receive alerts from Grafana in real time via the webhook
* Parse alert metadata including labels, annotations, dashboard links, and panel URLs
* Triage incoming alerts using AI agents and surface actionable insights
***
## Step 3 - Route alerts to the Clarion contact point
You can route alerts to Clarion by updating your **notification policy** or by adding Clarion as a contact point on individual alert rules.
### Option A - Default notification policy
1. Go to **Alerting > Notification policies**
2. Edit the **default policy** (or create a nested policy)
3. Set the **Contact point** to the Clarion contact point you created
4. Save the policy
### Option B - Per-rule contact point
1. Go to **Alerting > Alert rules**
2. Open the alert rule you want to forward to Clarion
3. In the **Notifications** section, override the contact point and select the Clarion contact point
4. Save the rule
Repeat for each alert rule you want Clarion to receive.
***
## Severity mapping
Clarion maps the `severity` label from your Grafana alerts to its own severity levels:
| Grafana `severity` label | Clarion severity |
| ------------------------------ | ---------------- |
| `critical` | Critical |
| `high` | High |
| `warning`, `medium` | Medium |
| `low`, `info`, `informational` | Low |
| *(missing or unrecognized)* | Medium |
> To control how Clarion prioritizes your alerts, add a `severity` label to your Grafana alert rules (e.g. `severity = critical`). If no severity label is present, alerts default to **Medium**.
***
## What happens next
Once configured, Clarion will automatically:
* Receive alerts from Grafana in real time via the webhook
* Parse alert metadata including labels, annotations, dashboard links, and panel URLs
* Triage incoming alerts using AI agents and surface actionable insights