

Estimated time: 5-10 minutes. You will need access to your Grafana instance (with Alerting permissions) and a Clarion workspace.
Prerequisites
- A Grafana instance (self-hosted or Grafana Cloud) with unified alerting enabled
- Alerting admin or editor permissions in Grafana
- A Clarion workspace with the Grafana integration available
Step 1 - Create a monitor in Clarion
- In Clarion, go to Settings > Integrations
- Find Grafana and click Add Monitor
- After you select the default severities Clarion generates a webhook URL and a webhook secret (Bearer token)
- Copy both values - you’ll need them in the next steps
Copy the webhook secret immediately - it is only displayed once. If you lose it, you’ll need to regenerate the monitor.
Step 2 - Create a contact point in Grafana
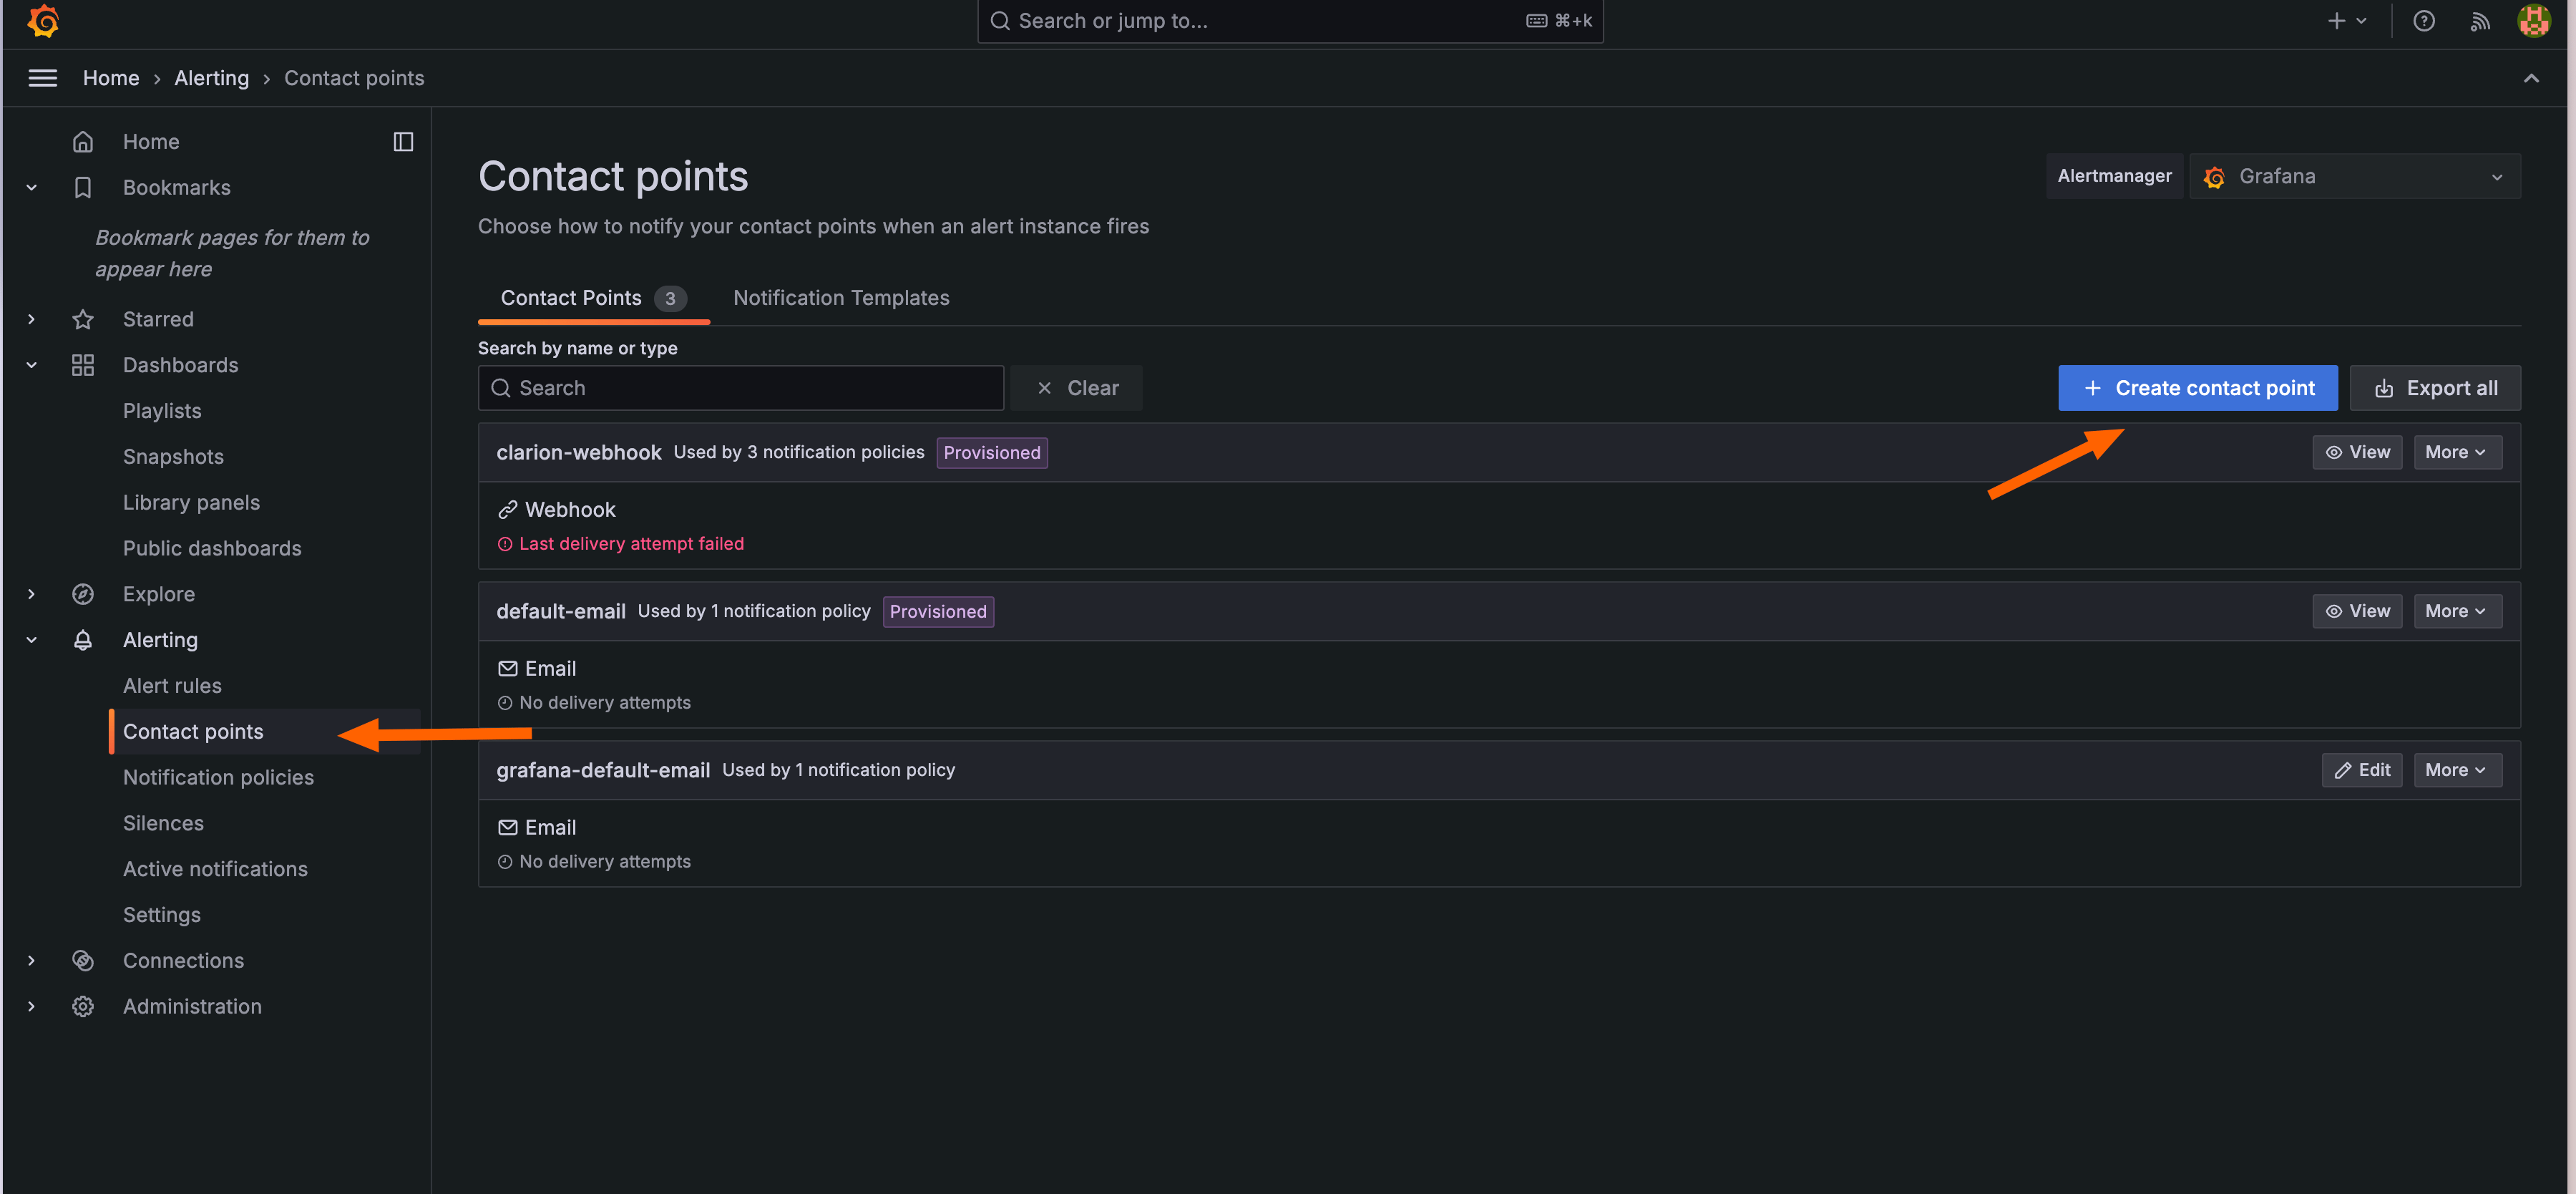
- In your Grafana instance, navigate to Alerting > Contact points
- Click + Create contact point
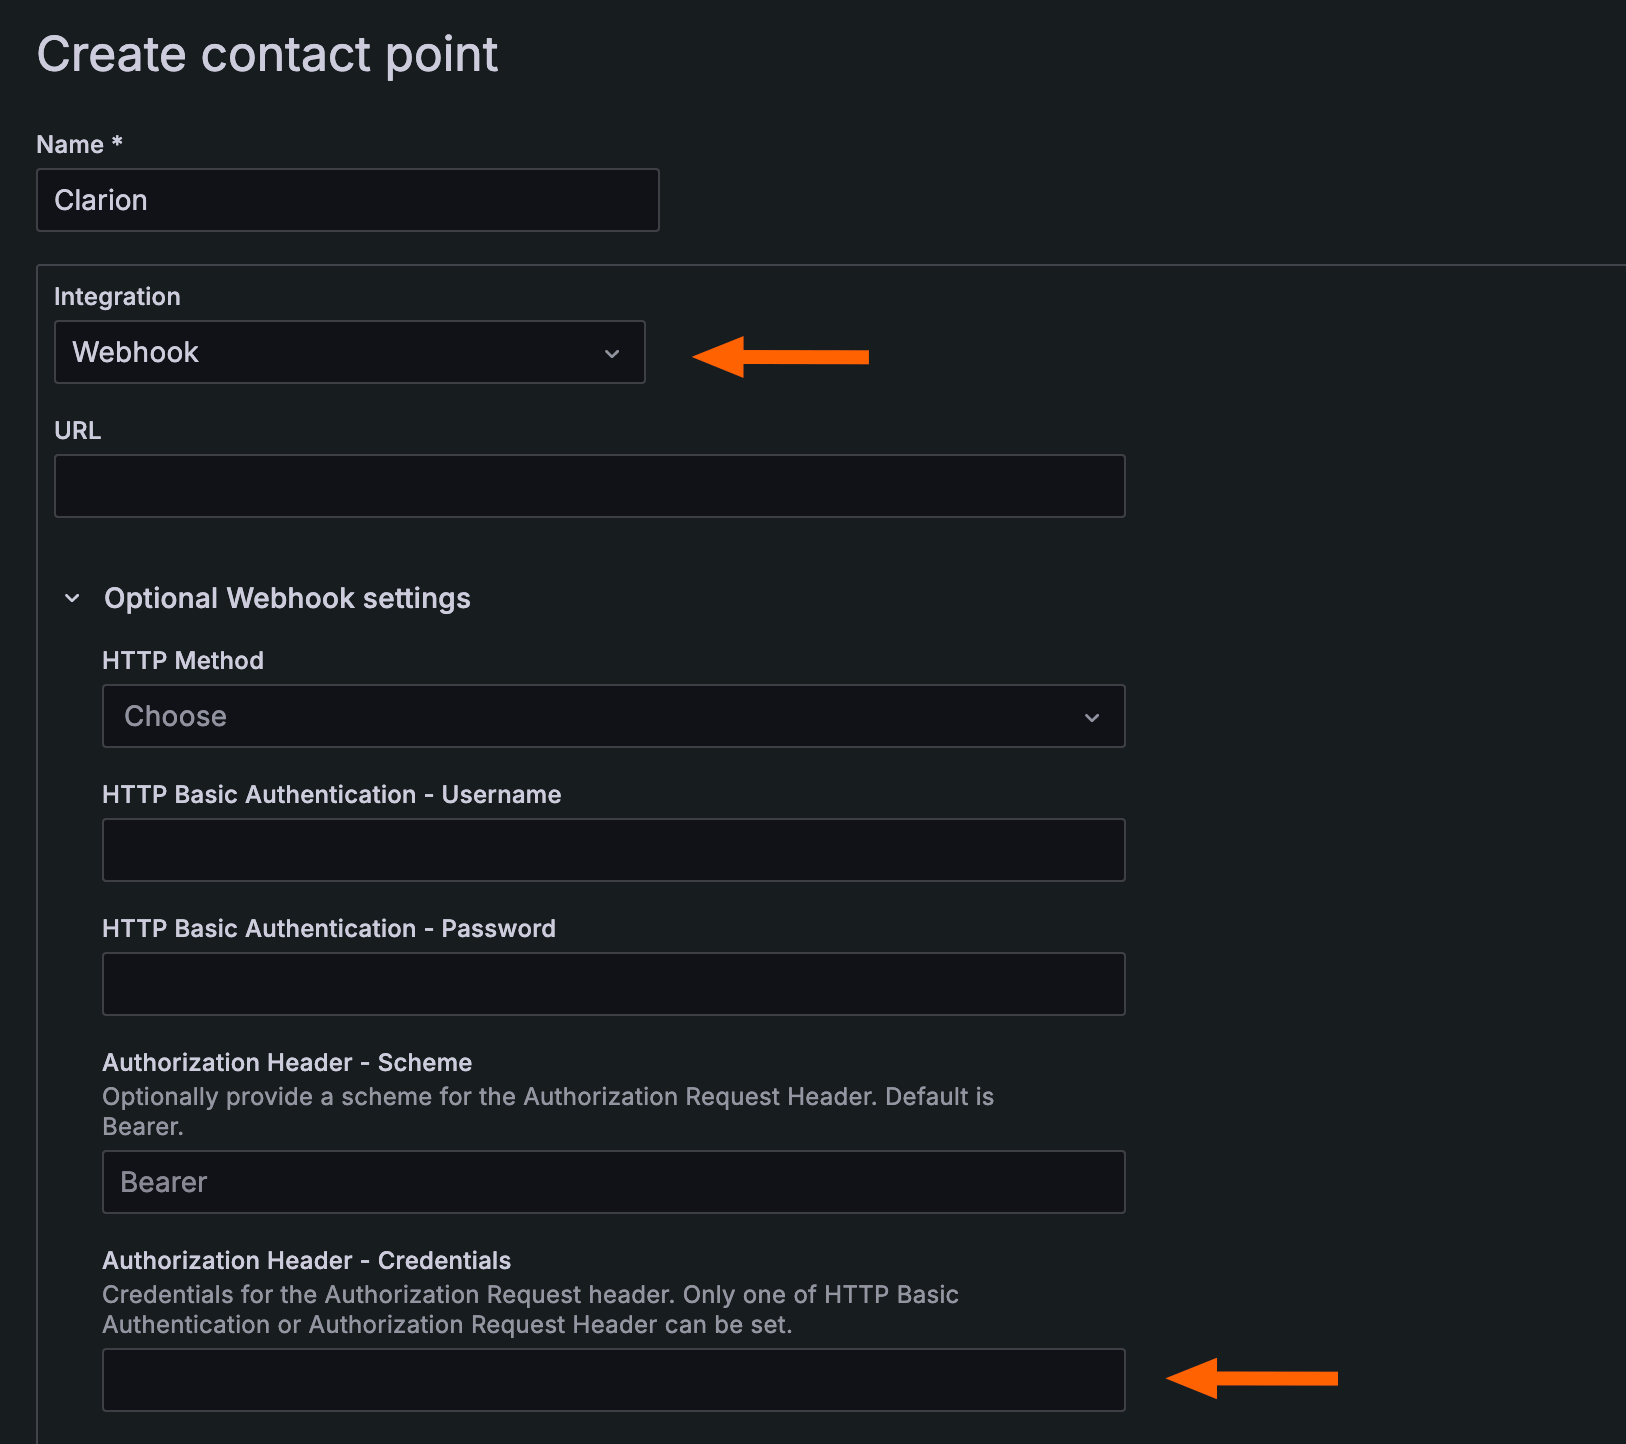
- Configure the contact point:
- Name: Give it a descriptive name (e.g.
Clarion) - Integration type: Select Webhook
- URL: Paste the webhook URL from Clarion
- HTTP Method: Leave as
POST - Authorization Header - Credentials: Paste the webhook secret from Clarion
- Name: Give it a descriptive name (e.g.
Setting the Credentials field in the Authorization Header section causes Grafana to send the secret as aBearertoken in theAuthorizationheader, which is how Clarion authenticates incoming requests.
- Click Save contact point
Step 3 - Route alerts to the Clarion contact point
You can route alerts to Clarion by updating your notification policy or by adding Clarion as a contact point on individual alert rules.Option A - Default notification policy
- Go to Alerting > Notification policies
- Edit the default policy (or create a nested policy)
- Set the Contact point to the Clarion contact point you created
- Save the policy
Option B - Per-rule contact point
- Go to Alerting > Alert rules
- Open the alert rule you want to forward to Clarion
- In the Notifications section, override the contact point and select the Clarion contact point
- Save the rule
Severity mapping
Clarion maps theseverity label from your Grafana alerts to its own severity levels:
To control how Clarion prioritizes your alerts, add aseveritylabel to your Grafana alert rules (e.g.severity = critical). If no severity label is present, alerts default to Medium.
What happens next
Once configured, Clarion will automatically:- Receive alerts from Grafana in real time via the webhook
- Parse alert metadata including labels, annotations, dashboard links, and panel URLs
- Triage incoming alerts using AI agents and surface actionable insights